


Three and a half seasons. Over 7 million pitches. And a clear signal buried in the data.
From 2024 to 2026, slugging percentage against the college four-seam fastball dropped from .530 to .503. Barrel rate fell from 21.5% to 19.9%. The rate of well-struck balls in the optimal launch angle window (exit velocity 95+, launch angle 10–30°) declined from 19.1% to 17.5%. From 2023 to 2026, four-seam usage dropped from 51.7% of all pitches thrown to 46.0%. Cutter usage more than doubled, from 2.2% to 5.8%, and the curveball went from 6.9% to 7.8%.
This isn’t a college baseball original. MLB went through the same shift starting around 2022, when front offices and pitching labs concluded that the four-seamer was most dangerous when it was of better quality and used less frequently. High-IVB fastballs surrounded by well-designed secondaries outperformed high-usage fastball-heavy approaches. As a result, hard contact declined and arsenal construction got smarter. The blueprint was built at the pro level. What’s happening in college baseball now is that blueprint trickling down through coaching hires, private training facilities, and a data infrastructure that didn’t exist at this level three years ago. The results are arriving in the data right on schedule.
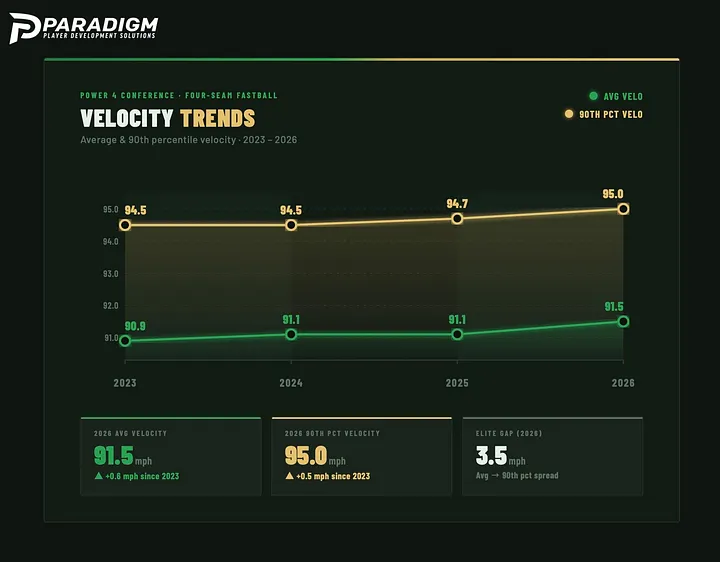
The instinct is to credit velo, and that’s not entirely wrong. Power 4 programs have seen average fastball velocity climb from 91.1 mph to 91.5 mph, with the 90th percentile jumping a half mile per hour, from 94.5 to 95.0. More gas at the elite level should mean harder pitches to square up, but the whiff data doesn’t cooperate with that narrative. InZoneWhiff% held at 13.1% in 2024 and barely moved to 12.9% in 2026. K% is flat across all three seasons. Hitters aren’t missing the fastball any more than they did. They’re just hitting it softer when they connect.

Despite the velo increase, the batted ball data shows the fingerprint of a pitch that’s seen a meaningful shape adjustment.

The core mechanism is induced vertical break. A four-seamer with elite IVB creates a perceptual illusion, meaning the hitter’s brain calculates that the ball will drop to a lower point than it actually arrives at. Induced vertical break on four seamers has increased from 15.6 in 2024 to 16.2 in 2026 (Power 4 up to 16.9”). High-IVB fastballs result in swings that end up underneath the pitch. The result isn’t always a miss, oftentimes it’s a weak pop-up or a topped grounder instead of a barrel. Chase rate reinforces this interpretation. Hitters chased the four-seamer 22.2% of the time in 2024. By 2026, that number dropped to 21.0%. Hitters are laying off the pitch more and still producing softer contact when they do swing.
If the pitch were simply harder to track at higher velocity, you’d expect chase rates to go up as hitters expand their zones against a pitch they can’t time up. Instead it went down. That means hitters aren’t being fooled by the pitch, they’re being beaten by it when it’s in the zone. The shape of the fastball is winning the at-bat, not just the velo reading. The best part is that shape is something that gets built deliberately behind the scenes
TrackMan has gone from 169 college programs in 2023 to 256 in 2026. Rapsodo is inside hundreds more across all levels. The practical effect of that buildout is that a college pitcher can now sit in a bullpen session and see in real time the spin efficiency, induced vertical break, spin axis, and tilt of every four-seamer they throw. The feedback loop that used to take a career now takes a single off season.

The coaching staff transformation matters just as much as the tools. Dedicated “Director of Pitching Development” and “Director of Analytics” roles, positions that barely existed five years ago, are now standard hires across the sport. Schools like Missouri and Texas Tech brought in Paradigm Player Development Solutions to build their player development infrastructure with analytics-first development and consulting. Additionally, where scouting reports once offered vague summaries like “this guy’s 86 to 88 with a slider”, they now detail pitch usage by count, movement profiles, hitter tendencies, and shape-specific performance data. The people building fastballs have changed. The results are showing up in season wide trends.

Sitting upstream of college programs is a private training ecosystem that has been doing this work for years. Facilities with TrackMan and Rapsodo run pitch design sessions for high school and college pitchers year-round, building fastball profiles around spin axis, wrist orientation, and release point before those players ever get to a college campus. Players are arriving at programs today with more data-informed repetitions on their four-seamer than any previous generation. The quality shows when they get there.
One specific problem the data infrastructure is helping solve is what people call the “deadzone” fastball, a movement profile range where a fastball’s IVB and horizontal break are too similar, producing a blended, predictable shape that elite hitters can easily barrel up. Research using Power 4 TrackMan data identified this phenomenon at the college level and found that many pitchers were throwing deadzone fastballs not because they lacked the physical profile to throw a better pitch, but because nobody was measuring it. When coaches can see the movement plot in real time, the correction is actionable within a single bullpen. That population of college fastballs is migrating away from hittable shapes and missing barrels.
The Power 4 / non-Power 4 split is the clearest proof of mechanism. Non-Power 4 velocity hasn’t moved across the same three-year window. If raw physical development were driving the hard contact decline, that split wouldn’t exist. The programs with better infrastructure are producing better fastball shapes. The disparity is a resource and data application gap, not a talent gap, and it will continue to narrow as the tools and insight continue to spread downward.
The hard contact decline is one half of the fastball story. The usage decline is equally important and directly related.
As pitch design infrastructure matured, it didn’t just make fastballs better. Secondaries became more valuable. The cutter is the clearest example. Nearly doubling from 3.2% to 5.8% of total pitches, it’s now the fastest-growing pitch in college baseball. The reasons are structural. The cutter lives 2–5 mph below a pitcher’s fastball, generating late horizontal movement that disrupts timing in ways a four-seamer can’t, and it is a pitch that can be taught with relative ease. Additionally, TrackMan data and pronation/supination bias can identify which pitchers have the spin profile and wrist orientation to throw a true cutter. That ability to know who should throw it and how to build it has made the pitch accessible to a much wider population of college arms than ever before. Where pitchers used to stumble into cut accidentally because of natural wrist orientation, programs are now building cutters on purpose.

The curveball’s rise follows the same logic. Thrown at a 6.9% rate in 2023 and a 7.8% clip in 2026, the raw numbers look small, but they are significant. The sweeper’s explosion as the dominant breaking ball created a secondary problem called pitch decay. When the sweeper becomes a pitcher’s most-used offspeed offering, the pitch eventually loses its teeth. Hitters see the shape too often, too early. The curveball solves that. It’s a true shape separator with enough vertical depth to live in a completely different visual plane and it has become the preferred early-count strike-stealer for pitchers who need a pitch that doesn’t eat into their slider’s effectiveness later in an at-bat. The curveball isn’t replacing the slider. It’s protecting it.
The result is a four-seam fastball that’s being asked to do less work by design. Programs now understand that a high-IVB fastball is most effective when contrasted against pitches that move in opposite directions with depth. The fastball establishes the vertical plane. The arsenal around it creates the tunnel. A 46% fastball rate with a well-designed supporting cast is a more dangerous pitching plan than a 48.6% rate built around weaker secondaries. Usage went down because pitch calling got smarter, not weaker.
The trends in the aggregate data don’t surprise us. They confirm what we’ve been building toward with our partner programs for the last two years.
When Paradigm works with a program, the starting point is always the same, assess fastball quality first. Not velocity in isolation. Not usage. Quality. What does the shape look like relative to the pitcher’s arm slot and release? Where is shape quality leaving value on the table? What does the arsenal look like around it, and is the fastball being deployed in a way that maximizes its effectiveness? Those questions drive everything.
The data from Paradigm partner schools reflects that philosophy. From 2025 to 2026, our programs’ average fastball velocity climbed from 89.2 to 90.1 mph and average IVB improved from 15.3 inches to 16.9 inches. This is a meaningful shape gain that goes well beyond what a velocity bump alone would produce. These year to year trends are the direct output of intentional fastball development baked into how we consult.

The work looks different at every program, but the direction is consistent. At Columbia University, we ran a staff-wide velocity program in the fall built around individualized throwing progressions, strength work, and TrackMan-tracked bullpen sessions designed to maximize each pitcher’s physical ceiling heading into the spring. At South Alabama, the fall work centered on a staff-wide pitch design revamp by evaluating every pitcher’s fastball shape relative to their arm slot, identifying shape inefficiencies, and building the offseason around correcting them before live competition. Both programs arrived at their 2026 seasons with better fastballs than they left with in 2025.
The most complete example of what this philosophy produces in-game is Fairleigh-Dickinson University. In 2025, FDU’s pitching staff threw fastballs 51% of the time, a rate that put them slightly above national averages and left their pitchers arsenals under leveraged. Working with Paradigm, the staff identified that their fastball quality had improved enough to be used more selectively and that their secondaries were strong enough to carry a heavier workload. By 2026, fastball usage dropped to 37%. That’s a 14-percentage-point shift in pitch calling philosophy, backed by data that told us the arsenal could support it. The result is FDU’s best start in the last ten years.
That’s the point the league-wide data is making, and it’s the point Paradigm has been operating on: the four-seam fastball is most valuable when it’s the best version of itself, thrown at the right time, with a supporting cast designed to make it impossible to sit on. Usage goes down, quality goes up, and the results follow.
The data from 2024 to 2026 shows a sport in the middle of a transformation, not at the end of one.
Non-Power 4 velocity slowly starting to increase while Power 4 velocity continues to rise is a preview of what happens as tools spread further down the competitive ladder. Cutter and curveball usage trending up is a preview of what happens as pitch design literacy becomes standard operating procedure rather than a Power conference advantage. The hard contact decline happening while whiff rates stay flat is a preview of what a fully optimized college fastball looks like when the development system is working the way it’s supposed to.
92 is the new 90. College freshmen are showing up with better shapes, better physical profiles, and better data literacy than any previous class. The MLB blueprint has officially arrived in college baseball as an operating reality for the programs that have built the infrastructure to execute it. And what the in-game data shows is that it’s working.
The four-seam fastball isn’t going anywhere. It’s just being built and used differently. Different foundations of usage, pitch design, and a surrounding arsenal designed to make fastballs more dangerous than they’ve ever been. The hitters on the other side of it are paying for it in the contact numbers. Three years in, the trend line only points one direction.
Three and a half seasons. Over 7 million pitches. And a clear signal buried in the data.
From 2024 to 2026, slugging percentage against the college four-seam fastball dropped from .530 to .503. Barrel rate fell from 21.5% to 19.9%. The rate of well-struck balls in the optimal launch angle window (exit velocity 95+, launch angle 10–30°) declined from 19.1% to 17.5%. From 2023 to 2026, four-seam usage dropped from 51.7% of all pitches thrown to 46.0%. Cutter usage more than doubled, from 2.2% to 5.8%, and the curveball went from 6.9% to 7.8%.
This isn’t a college baseball original. MLB went through the same shift starting around 2022, when front offices and pitching labs concluded that the four-seamer was most dangerous when it was of better quality and used less frequently. High-IVB fastballs surrounded by well-designed secondaries outperformed high-usage fastball-heavy approaches. As a result, hard contact declined and arsenal construction got smarter. The blueprint was built at the pro level. What’s happening in college baseball now is that blueprint trickling down through coaching hires, private training facilities, and a data infrastructure that didn’t exist at this level three years ago. The results are arriving in the data right on schedule.
The instinct is to credit velo, and that’s not entirely wrong. Power 4 programs have seen average fastball velocity climb from 91.1 mph to 91.5 mph, with the 90th percentile jumping a half mile per hour, from 94.5 to 95.0. More gas at the elite level should mean harder pitches to square up, but the whiff data doesn’t cooperate with that narrative. InZoneWhiff% held at 13.1% in 2024 and barely moved to 12.9% in 2026. K% is flat across all three seasons. Hitters aren’t missing the fastball any more than they did. They’re just hitting it softer when they connect.
Despite the velo increase, the batted ball data shows the fingerprint of a pitch that’s seen a meaningful shape adjustment.
The core mechanism is induced vertical break. A four-seamer with elite IVB creates a perceptual illusion, meaning the hitter’s brain calculates that the ball will drop to a lower point than it actually arrives at. Induced vertical break on four seamers has increased from 15.6 in 2024 to 16.2 in 2026 (Power 4 up to 16.9”). High-IVB fastballs result in swings that end up underneath the pitch. The result isn’t always a miss, oftentimes it’s a weak pop-up or a topped grounder instead of a barrel. Chase rate reinforces this interpretation. Hitters chased the four-seamer 22.2% of the time in 2024. By 2026, that number dropped to 21.0%. Hitters are laying off the pitch more and still producing softer contact when they do swing.
If the pitch were simply harder to track at higher velocity, you’d expect chase rates to go up as hitters expand their zones against a pitch they can’t time up. Instead it went down. That means hitters aren’t being fooled by the pitch, they’re being beaten by it when it’s in the zone. The shape of the fastball is winning the at-bat, not just the velo reading. The best part is that shape is something that gets built deliberately behind the scenes
TrackMan has gone from 169 college programs in 2023 to 256 in 2026. Rapsodo is inside hundreds more across all levels. The practical effect of that buildout is that a college pitcher can now sit in a bullpen session and see in real time the spin efficiency, induced vertical break, spin axis, and tilt of every four-seamer they throw. The feedback loop that used to take a career now takes a single off season.
The coaching staff transformation matters just as much as the tools. Dedicated “Director of Pitching Development” and “Director of Analytics” roles, positions that barely existed five years ago, are now standard hires across the sport. Schools like Missouri and Texas Tech brought in Paradigm Player Development Solutions to build their player development infrastructure with analytics-first development and consulting. Additionally, where scouting reports once offered vague summaries like “this guy’s 86 to 88 with a slider”, they now detail pitch usage by count, movement profiles, hitter tendencies, and shape-specific performance data. The people building fastballs have changed. The results are showing up in season wide trends.
Sitting upstream of college programs is a private training ecosystem that has been doing this work for years. Facilities with TrackMan and Rapsodo run pitch design sessions for high school and college pitchers year-round, building fastball profiles around spin axis, wrist orientation, and release point before those players ever get to a college campus. Players are arriving at programs today with more data-informed repetitions on their four-seamer than any previous generation. The quality shows when they get there.
One specific problem the data infrastructure is helping solve is what people call the “deadzone” fastball, a movement profile range where a fastball’s IVB and horizontal break are too similar, producing a blended, predictable shape that elite hitters can easily barrel up. Research using Power 4 TrackMan data identified this phenomenon at the college level and found that many pitchers were throwing deadzone fastballs not because they lacked the physical profile to throw a better pitch, but because nobody was measuring it. When coaches can see the movement plot in real time, the correction is actionable within a single bullpen. That population of college fastballs is migrating away from hittable shapes and missing barrels.
The Power 4 / non-Power 4 split is the clearest proof of mechanism. Non-Power 4 velocity hasn’t moved across the same three-year window. If raw physical development were driving the hard contact decline, that split wouldn’t exist. The programs with better infrastructure are producing better fastball shapes. The disparity is a resource and data application gap, not a talent gap, and it will continue to narrow as the tools and insight continue to spread downward.
The hard contact decline is one half of the fastball story. The usage decline is equally important and directly related.
As pitch design infrastructure matured, it didn’t just make fastballs better. Secondaries became more valuable. The cutter is the clearest example. Nearly doubling from 3.2% to 5.8% of total pitches, it’s now the fastest-growing pitch in college baseball. The reasons are structural. The cutter lives 2–5 mph below a pitcher’s fastball, generating late horizontal movement that disrupts timing in ways a four-seamer can’t, and it is a pitch that can be taught with relative ease. Additionally, TrackMan data and pronation/supination bias can identify which pitchers have the spin profile and wrist orientation to throw a true cutter. That ability to know who should throw it and how to build it has made the pitch accessible to a much wider population of college arms than ever before. Where pitchers used to stumble into cut accidentally because of natural wrist orientation, programs are now building cutters on purpose.
The curveball’s rise follows the same logic. Thrown at a 6.9% rate in 2023 and a 7.8% clip in 2026, the raw numbers look small, but they are significant. The sweeper’s explosion as the dominant breaking ball created a secondary problem called pitch decay. When the sweeper becomes a pitcher’s most-used offspeed offering, the pitch eventually loses its teeth. Hitters see the shape too often, too early. The curveball solves that. It’s a true shape separator with enough vertical depth to live in a completely different visual plane and it has become the preferred early-count strike-stealer for pitchers who need a pitch that doesn’t eat into their slider’s effectiveness later in an at-bat. The curveball isn’t replacing the slider. It’s protecting it.
The result is a four-seam fastball that’s being asked to do less work by design. Programs now understand that a high-IVB fastball is most effective when contrasted against pitches that move in opposite directions with depth. The fastball establishes the vertical plane. The arsenal around it creates the tunnel. A 46% fastball rate with a well-designed supporting cast is a more dangerous pitching plan than a 48.6% rate built around weaker secondaries. Usage went down because pitch calling got smarter, not weaker.
The trends in the aggregate data don’t surprise us. They confirm what we’ve been building toward with our partner programs for the last two years.
When Paradigm works with a program, the starting point is always the same, assess fastball quality first. Not velocity in isolation. Not usage. Quality. What does the shape look like relative to the pitcher’s arm slot and release? Where is shape quality leaving value on the table? What does the arsenal look like around it, and is the fastball being deployed in a way that maximizes its effectiveness? Those questions drive everything.
The data from Paradigm partner schools reflects that philosophy. From 2025 to 2026, our programs’ average fastball velocity climbed from 89.2 to 90.1 mph and average IVB improved from 15.3 inches to 16.9 inches. This is a meaningful shape gain that goes well beyond what a velocity bump alone would produce. These year to year trends are the direct output of intentional fastball development baked into how we consult.
The work looks different at every program, but the direction is consistent. At Columbia University, we ran a staff-wide velocity program in the fall built around individualized throwing progressions, strength work, and TrackMan-tracked bullpen sessions designed to maximize each pitcher’s physical ceiling heading into the spring. At South Alabama, the fall work centered on a staff-wide pitch design revamp by evaluating every pitcher’s fastball shape relative to their arm slot, identifying shape inefficiencies, and building the offseason around correcting them before live competition. Both programs arrived at their 2026 seasons with better fastballs than they left with in 2025.
The most complete example of what this philosophy produces in-game is Fairleigh-Dickinson University. In 2025, FDU’s pitching staff threw fastballs 51% of the time, a rate that put them slightly above national averages and left their pitchers arsenals under leveraged. Working with Paradigm, the staff identified that their fastball quality had improved enough to be used more selectively and that their secondaries were strong enough to carry a heavier workload. By 2026, fastball usage dropped to 37%. That’s a 14-percentage-point shift in pitch calling philosophy, backed by data that told us the arsenal could support it. The result is FDU’s best start in the last ten years.
That’s the point the league-wide data is making, and it’s the point Paradigm has been operating on: the four-seam fastball is most valuable when it’s the best version of itself, thrown at the right time, with a supporting cast designed to make it impossible to sit on. Usage goes down, quality goes up, and the results follow.
The data from 2024 to 2026 shows a sport in the middle of a transformation, not at the end of one.
Non-Power 4 velocity slowly starting to increase while Power 4 velocity continues to rise is a preview of what happens as tools spread further down the competitive ladder. Cutter and curveball usage trending up is a preview of what happens as pitch design literacy becomes standard operating procedure rather than a Power conference advantage. The hard contact decline happening while whiff rates stay flat is a preview of what a fully optimized college fastball looks like when the development system is working the way it’s supposed to.
92 is the new 90. College freshmen are showing up with better shapes, better physical profiles, and better data literacy than any previous class. The MLB blueprint has officially arrived in college baseball as an operating reality for the programs that have built the infrastructure to execute it. And what the in-game data shows is that it’s working.
The four-seam fastball isn’t going anywhere. It’s just being built and used differently. Different foundations of usage, pitch design, and a surrounding arsenal designed to make fastballs more dangerous than they’ve ever been. The hitters on the other side of it are paying for it in the contact numbers. Three years in, the trend line only points one direction.

